A size medium black hoodie is available on Shopify. The same unit is promised to a wholesale buyer. Two returns are sitting in a bin, not back in stock. Customer service sees one number, the warehouse sees another, and the sales team finds out after the order is already placed.
That is what bad inventory accuracy feels like for a fashion brand. It is not a neat spreadsheet problem. It is a daily operating risk across sizes, colors, bundles, returns, wholesale holds, and sales channels.
This guide explains the inventory accuracy formula, the KPI set worth tracking, and the fixes that work for hundreds or thousands of variants.
What inventory accuracy means for a fashion brand
Inventory accuracy is the match between the stock your system says you have and the stock physically available to sell, pick, reserve, or return to inventory.
For a fashion brand, that match has to happen at the variant level. A style-level count is not enough. If your system says you have 120 units of the Luna Rib Tank, but the warehouse has 38 small black, 0 medium black, 42 small ivory, and 40 medium ivory, the style count hides the real problem.
Accuracy also changes by status: available, reserved, picked, returned, damaged, in transit, or on a purchase order. That is why growing brands need more than a monthly stock check. They need a shared inventory view across sales, warehouse, returns, and finance. If your channels and warehouse tools are not aligned, Blastramp’s inventory and order integrations can connect the systems that create those stock signals.
The inventory accuracy formula, with an apparel example
The basic inventory accuracy formula is:
Inventory accuracy rate = (accurate inventory records / total inventory records checked) x 100
A record can mean a SKU, bin, style-color-size variant, or location count. For fashion brands, variant-level SKU records are the better unit because they catch the errors customers actually feel.
Here is a simple example. A women’s apparel brand cycle counts 500 variant SKUs after a weekend drop. The count finds 455 records where the system quantity matches the physical count.
Inventory accuracy rate = (455 / 500) x 100 = 91%
A 91% result means 45 variant records cannot be trusted. If 12 of those are bestsellers in broken sizes, the brand can oversell, block available inventory, or buy more stock than it needs.
You can also track unit accuracy: (physical units counted / system units recorded) x 100. If the system shows 1,000 units and the count finds 960, unit accuracy is 96%. Use this for the big picture, but keep variant accuracy as the operating metric.
What is a good inventory accuracy KPI target?
The right target depends on order volume, SKU count, channel mix, and how many manual handoffs sit between receiving and shipping.
For a small fashion brand under 200 active SKUs, anything below 95% accuracy should trigger a workflow review. With 1,500 active variants across DTC, wholesale, and a 3PL, the target should be higher because each error can spread.
A good inventory accuracy KPI set should include:
| KPI | What it tells you | Fashion example |
|---|---|---|
| Variant record accuracy | Whether SKU counts match at size-color level | Medium denim jacket shows 8 available, warehouse finds 3 |
| Unit accuracy | Total system units vs physical units | 9,800 units recorded, 9,510 found |
| Count variance rate | How often counts are off | 7% of counted SKUs had a mismatch this week |
| Stockout rate | How often items hit zero when demand still exists | Black size 8 sells out during paid traffic push |
| Oversell rate | Orders accepted for stock that is not available | 14 orders need split shipment or cancellation |
| Return-to-stock lag | Time from return arrival to sellable inventory | Returned dresses wait 5 days before inspection |
| Adjustment value | Dollar value of inventory corrections | $18,000 in shrink, damage, and count changes this month |
The point is not to create a dashboard nobody uses. The point is to catch the few signals that predict expensive problems: oversells, stockouts, delayed returns, and repeated count changes on the same variants.
If these numbers are hard to produce, this fashion inventory management software evaluation guide gives a useful buying framework.
Why variant-heavy catalogs distort inventory accuracy
A plain T-shirt can look simple in a sales report. In operations, it may be 6 sizes, 5 colors, 2 fits, and 3 sales channels. That is 180 records before you count locations, bundles, returns, and wholesale allocations.
The more variants you run, the easier it is for an error to hide. A style can look healthy while the money-making sizes are gone. A warehouse can pick the last medium instead of the last large. A return can be placed back into stock under the wrong color code.
Common distortion points include:
- Size curves: a style-level report may show 60 units available, but 44 are XS and only 1 is medium.
- Color names: “bone,” “ivory,” and “cream” can become separate records for the same physical item.
- Wholesale reserves: a B2B order may reserve 200 units weeks before shipment while DTC keeps selling.
- Returns: the National Retail Federation reported that 2024 retail returns were projected at $890 billion, equal to 16.9% of annual sales.
- Bundles: a three-pack sock bundle can appear available even when one component is out.
These are normal fashion operations. That is why inventory accuracy best practices have to be built around variant control, not just total quantity control.
Improving inventory accuracy with better daily workflows
Improving inventory accuracy starts with fewer blind spots in the daily flow. Most errors are created during receiving, picking, returns, channel updates, or manual adjustments.
Start with these workflow fixes.
Use barcode scans at each stock movement
A barcode scan creates a cleaner record than a typed SKU, especially when product names look similar. GS1 explains that barcodes encode identifiers such as product, shipment, and location data, which lets supply chain teams identify and track products as they move.
For apparel, scanning should happen at receiving, putaway, pick, pack, transfer, cycle count, and returns inspection. The scan confirms the variant, location, and action in the moment instead of asking someone to fix the record later.
Count high-risk SKUs more often
Do not treat every SKU the same. A slow-selling belt in one color does not need the same count cadence as a bestseller dress with 14 variants and weekly returns.
Use cycle counts by risk group:
- Daily: top sellers, low-stock items, high-return items, launch products
- Weekly: active seasonal SKUs and wholesale-reserved SKUs
- Monthly: slow movers and backstock locations
- Quarterly: dormant, damaged, or archived inventory
This keeps count work close to the items most likely to cause revenue loss. It also avoids full shutdowns for wall-to-wall counts.
Reconcile channels before major selling periods
Before a product drop, market sale, or wholesale ship window, reconcile system stock against physical stock and channel availability. Confirm which units are available, reserved, damaged, returned, or in transit.
If your team sells through DTC and wholesale, Blastramp’s guide to balancing B2B and B2C stock explains how shared inventory pressure shows up across channels.
Reduce manual adjustments
Manual stock changes are sometimes needed. But every adjustment should have a reason code: count correction, damage, lost unit, return inspection, wholesale reserve, transfer, or fulfillment error.
Review the top adjustment reasons monthly. If “count correction” keeps appearing for the same location or product family, the issue is probably process, not luck.
How to reduce stockouts, oversells, and return-to-stock lag
Once you can measure accuracy, connect it to outcomes that matter to the business.
A stockout means demand exists but stock is not available. An oversell means the brand accepted an order it cannot fulfill as promised. Return-to-stock lag means sellable returned inventory is stuck outside the available pool.
Each one needs a different fix.
Stockout rate: watch size-level availability
Calculate stockout rate by variant, not just style.
Stockout rate = (number of SKUs out of stock / total active SKUs) x 100
If 30 of 600 active variants are out of stock, the stockout rate is 5%. But if those 30 variants are core sizes in paid campaigns, the revenue impact is far higher than the percentage suggests.
Use low-stock alerts by variant, sell-through velocity, and replenishment timing. For brands scaling beyond spreadsheet control, Blastramp’s warehouse inventory management software guide explains how warehouse workflows affect fulfillment speed and stock visibility.
Oversell rate: measure accepted orders that cannot ship
Oversell rate = (oversold orders / total orders) x 100
If a weekend sale produces 2,000 orders and 24 cannot ship because stock is missing, the oversell rate is 1.2%. That looks small until customer service handles refunds, discount codes, apology emails, and split shipments.
Oversells often come from delayed channel sync, manual reserves, unscanned picks, or returns marked sellable too early.
Return-to-stock lag: track time, not just count
Return-to-stock lag = average time from return arrival to available-to-sell status
If returned denim arrives Monday and is not inspected until Friday, those units are invisible for nearly a week. During a sale, that can create a false stockout while sellable product sits in a tote.
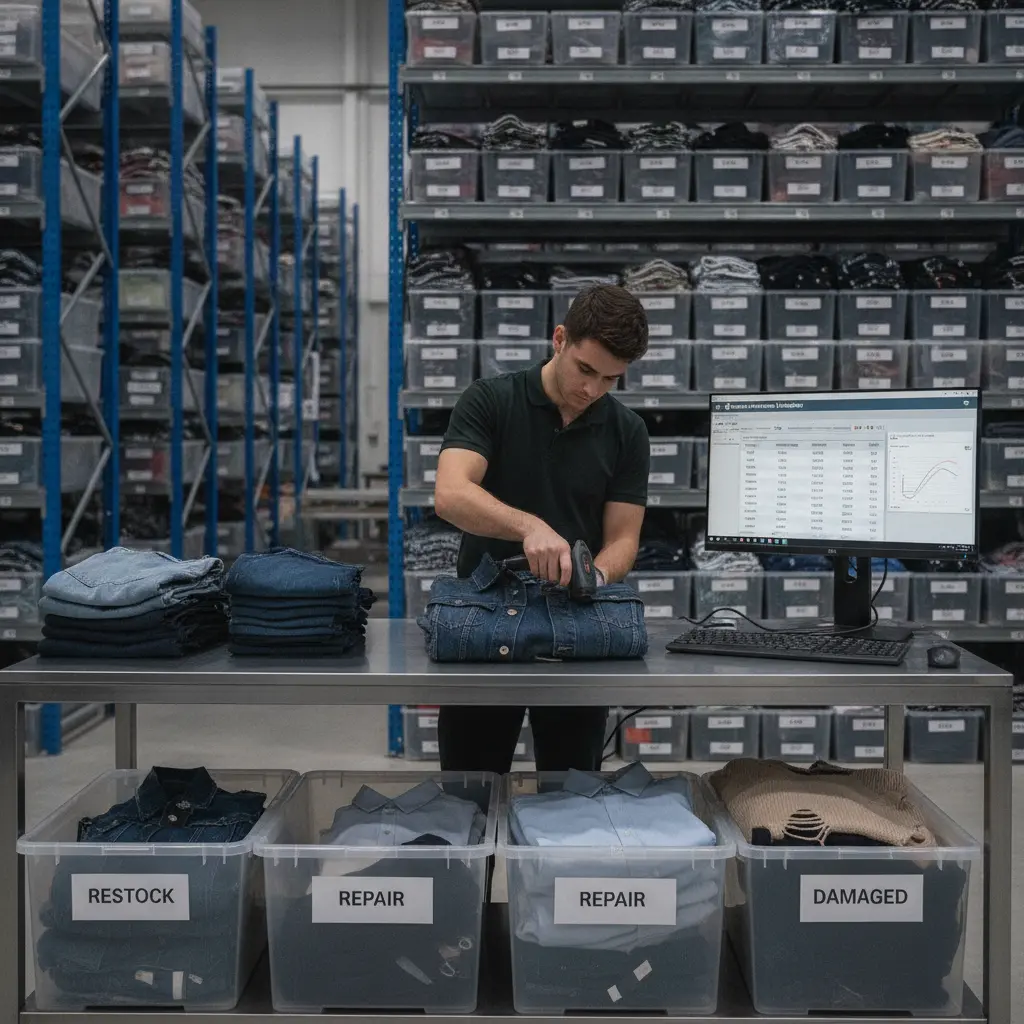
Set a service target. For example, inspect and sort returns within 24 hours for top sellers and 48 hours for slower items. Use separate statuses for received, inspecting, restock, repair, damaged, and vendor return.
Inventory accuracy best practices by growth stage
Inventory accuracy best practices change as the brand grows. A founder-led team can fix many issues with discipline. A multi-channel brand needs system control.
Under 200 active SKUs
At this stage, focus on clean SKU naming, weekly counts for bestsellers, and one source of truth. Avoid duplicate variant records. Do not let each sales channel become its own inventory system.
200 to 1,000 active SKUs
Add barcode scanning, cycle count rules, and adjustment reason codes. Count high-velocity SKUs weekly. Reconcile before launches and major wholesale orders.
This is often where spreadsheets start to break. If the team is weighing the cost of a better system, this inventory management software cost and ROI guide is a direct place to review Blastramp plan fit and next steps.
1,000+ active variants
At this point, accuracy depends on connected systems. DTC, wholesale, warehouse, returns, accounting, and planning should not be maintained through manual exports. Track accuracy by location, variant, and source of error.
A simple weekly inventory accuracy review
You do not need a long meeting to improve stock control. You need a repeatable weekly review:
- Review inventory accuracy rate from the latest counts.
- List the top 10 count variances by dollar value.
- Check stockout rate for active products.
- Review oversold orders and root causes.
- Check return-to-stock lag for top sellers.
- Review manual adjustments by reason code.
- Assign one workflow fix for the week.
If the same hoodie variant has been adjusted three weeks in a row, decide who changes the receiving, pick, or return process.
For brands that want this tracked inside a connected inventory and order system, the next step is to request a Blastramp demo and review your current stack, channels, and warehouse flow.
FAQ
What is inventory accuracy?
Inventory accuracy is the match between recorded stock and actual physical stock. For fashion brands, the most useful view is variant-level accuracy by size, color, location, and status.
What is the inventory accuracy formula?
The most common formula is: inventory accuracy rate = (accurate inventory records / total inventory records checked) x 100. Fashion brands should calculate it by variant SKU, not only by total units.
What is a good inventory accuracy percentage?
Many growing brands should aim for at least 95% as a starting point, with tighter targets for bestsellers and high-volume channels. The target should rise as order volume, SKU count, and channel count increase.
What is the best inventory accuracy KPI?
There is no single best KPI. Track variant record accuracy, count variance, stockout rate, oversell rate, return-to-stock lag, and adjustment value together. That mix shows both data quality and business impact.
How can fashion brands improve inventory accuracy fastest?
Start with barcode scans, cycle counts for high-risk SKUs, clear return statuses, and weekly reconciliation before high-volume sales periods. Then connect channels and warehouse tools so stock changes do not depend on manual updates.
Inventory accuracy gets harder as your brand adds styles, sizes, sales channels, wholesale accounts, and return volume. Blastramp helps fashion and apparel teams manage inventory, orders, warehouse workflows, and integrations from one connected system.
If your team is ready to reduce oversells, shorten return-to-stock lag, and trust variant-level inventory again, request a Blastramp demo.